Percolation on Growing Graphs with Infinite-order Phase Transitions
SLMath - October 2025
Siobhan Roberts
Water percolates through sandstone. Coffee percolates to achieve a bold, strong brew. Ideas percolate over time.
Etymologically, “percolation” originates from the Latin word “percolare,” meaning “to strain” or “to filter.” Scientifically, in the 1940s the chemist Rosalind Franklin studied the porous structure of coal — leading to the application of coal as a molecular sieve in gas masks.
Mathematically, “percolation theory” was introduced by Simon Broadbent and John Hammersley in a 1957 paper that provided a quantitative model of the percolation phenomenon — representing it as a connected graph of nodes and edges. By tracking connections, mathematicians investigate how graphs form and fragment.
As the authors stated in the introduction, their research studied “in a general way, how the random properties of a ‘medium’ influence the percolation of a ‘fluid’ through it…Fluid and medium bear general interpretations: for example, solute diffusing through solvent, electrons migrating over an atomic lattice, molecules penetrating a porous solid, disease infecting a community.”
Over the intervening years, applications accumulated apace: the World-Wide Web, wireless telecommunications, cybersecurity, biological materials, geochemical processes, cognitive psychology, social networks, ecological systems, et cetera.
The mathematics advanced in tandem.
Percolation theory was a central concern at the Simons Laufer Mathematical Sciences Institute in Berkeley during the program on Probability and Statistics of Discrete Structures (P.S.D.S.) from January to May 2025. Two teams of probabilists, each with different tools, pursued percolation research on dynamic, growing graphs.
One team used a model that related the problem to branching random walks with killing — particles move randomly; and in some graph regions particles are removed, or killed.
A second team used a model that represented percolation as an evolving network, where new vertices enter and interact with the existent structure. Specifically, they studied the “rich get richer” or preferential attachment model — certain nodes influence the dynamics in a biased fashion. Such models describe, for example, how social networks like Facebook grow when new members join and prefer to connect with already popular members, who, in turn, attract more and more connections and grow more and more popular.
Both team’s approaches illuminate the vulnerability or resilience of a network to random connectivity failures. With a social network, such failures could occur accidentally through an algorithmic glitch, or intentionally through a hack.
“The approaches are rather different, and developed independently, but they emerged at the same time and the results are probably going to be somewhat similar,” said Remco van der Hofstad of the Eindhoven University of Technology, the lead organizer of the P.S.D.S. program and the Simons Visiting Professor.
Dr. van der Hofstad is part of the second team, together with SLMath Chern Professor Shankar Bhamidi and research member Sayan Banerjee, both of the University of North Carolina; SLMath postdoc Rounak Ray; and Rajat Hazra who joined remotely from Leiden University.
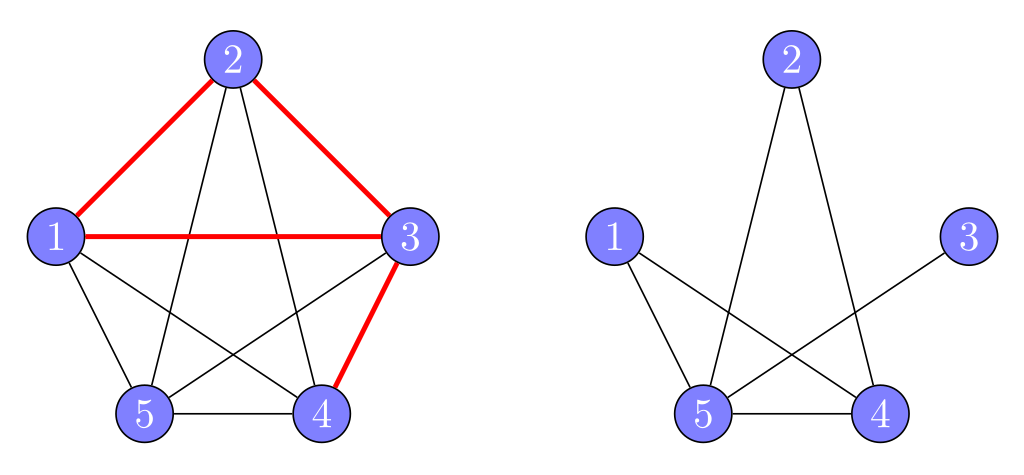
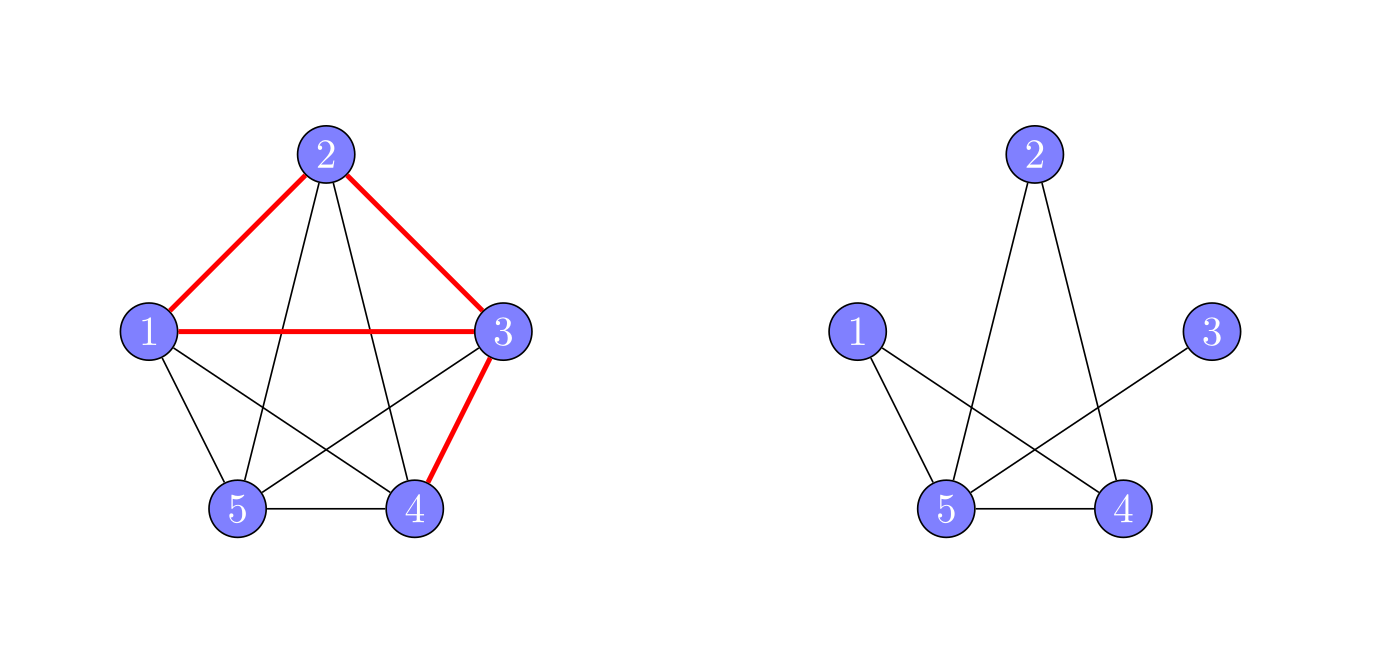
Percolation theory involves randomly removing connections in a lattice, graph or network. After removing vertices or edges — vertex percolation is more general, but edge percolation is more common — researchers analyze the remaining connections. A connected structure is said to “percolate” when it can be traversed from one side to another, top to bottom, point A to point B. “You can basically go between anywhere and anywhere in the medium,” Dr. van der Hofstad said.
When an edge, or a number of edges, are randomly removed, what remains are “connected components,” clusters large and small. Researchers are most interested in component behaviour around the “critical point” — a.k.a. “critical threshold” or “critical value.”
The critical threshold describes how many edges need to be randomly removed to break the connectivity structure of the underlying network, and thus is a measure of resilience of this network. “The behaviour close to this critical value is fascinating, with connected components of random and fractal-like shapes appearing,” said Dr. van der Hofstad.
Removing a few edges has little impact on connectivity; the effect of eliminating many edges is more significant. The critical point is the threshold at which a dramatic change in connectivity occurs. Below the critical point, connected components are finite; above the critical point, connected components are infinite. At the threshold there is a “phase transition.” Like water turning to ice at the 0°C freezing point, a phase transition from finite to infinite components occurs at the critical point.
“For the models that we have studied, surprisingly, the subcritical behaviour is completely different compared to other random graph models on which percolation had been investigated so far,” said Dr. van der Hofstad.
This raised a question: Why?
Typically, as the critical connectivity threshold approaches, the average size of network components dramatically increases. In this case, however, the average component size remained stable and bounded. “This suggests an entirely different ‘universality class’ of network behaviour,” Dr. van der Hofstad said — a novel way that networks might organize, which could have implications for understanding complex systems.
This new universality class, he explained, has an “infinite-order phase transition” (sometimes called the Berezinskii–Kosterlitz–Thouless transition; which led to the 2016 Nobel Prize in physics). “Infinite-order transitions are rare, and are closely related to the random medium on which percolation lives,” he said. “However, we do not really understand the reasons behind this infinite-order phase transition.”
Dr. van der Hofstad and his collaborators developed new techniques, melding their individual areas of expertise in addressing different network scales, local and global — with combinatorics and tree graph inequalities mixed with stochastic approximation techniques, for example. This recipe generated predictions for the size of the largest and second-largest connected components after randomly removing network connections.
“It’s kind of a small miracle that, somehow, something purely local and something very global both conspire to give you the full picture,” said Dr. Banerjee. “It is a very satisfying picture.”
The researchers are close to mathematically proving their prediction, but as Dr. van der Hofstad noted, “Mathematics is hard to predict.”
Rajat Hazra, who contributed from afar in Leiden, marveled at the “beautiful mathematics” that flowed from this research during the SLMath program. Dr. Hazra said, “I’m still trying to grasp all the ideas they discovered.”